Thinking about inflation? Me, too. With recent increases in government tariffs on foreign goods, the specter of higher inflation has increased, and the potential impact on your expenses may be a worry. But the impacts of inflation are not always bad—or as bad as we may think. Inflation is demonized because we tend to notice higher prices for gas or groceries on a regular basis, but we tend not to notice when prices stay neutral or go down, or when our income goes up.
When it comes to personal finance, inflation is an unavoidable economic reality. Time passes, prices rise and the purchasing power of your dollar goes down, right? Well, yes and no. Truly understanding the impact of inflation on your future requires a closer look. It can be tempting to write off high inflation rates as something you can’t control, but refining your understanding of inflation in general and your personal inflation rate in particular can help you make better financial decisions.
Inflation doesn’t necessarily mean we will suffer a loss of buying power. We all have our own inflation rate. If the overall US inflation rate increases from its target of 2 percent to, say, 7 percent, your personal inflation rate could be significantly lower than the national numbers. We can influence how inflation affects us personally by how we manage our money.
Before we take a closer look—what is inflation?
More than simply an increase in prices, inflation is an overall price level increase for, generally, all goods and services in the economy. The government tracks inflation through its Consumer Price Index (CPI) which measures the average change over time in the prices paid by urban consumers for a market basket of consumer goods and services. On average, the Federal Reserve aims for an inflation rate of 2% per year for long-term price stability and maximum employment. Just as overly high rates of inflation can strain consumers, a too low inflation rate can cause interest rates to decline and make it more difficult to recover from an economic downturn.
Inflation can be good, bad, or neutral for your wallet.
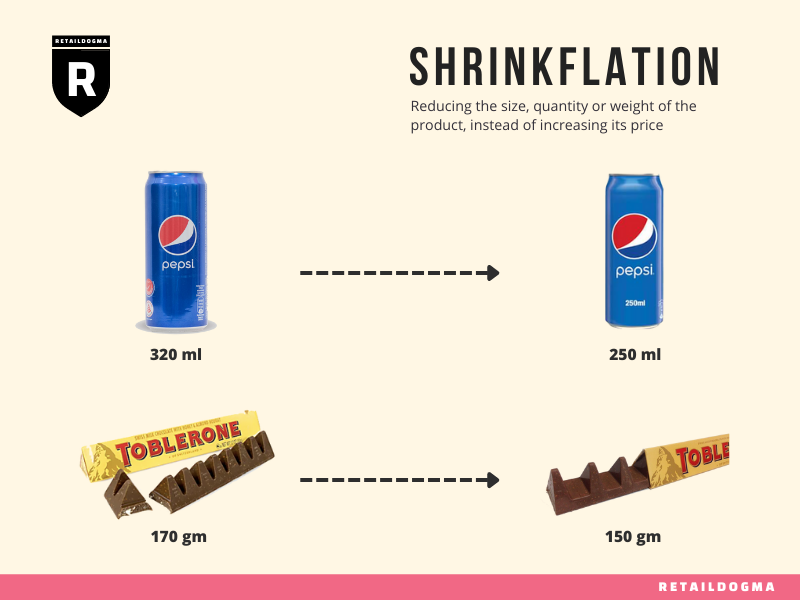
We are most familiar with the “bad” side of inflation. Prices on healthcare and education, for example, have increased faster than the median income over the last couple of decades. After the pandemic, many companies took advantage of temporary inflationary pressures such as delays in supply chains and pent-up consumer demand (coupled with increased savings) to dramatically increase prices (or reduce product sizes—referred to as “shrinkflation”), and their profits. But even when inflation is low, if we keep significant money under the mattress or in a low (below inflation) interest-bearing checking account, we will lose buying power over time.
If rising inflation rates have you concerned about the value of your money, considering the “good” side of inflation can help. In fact, there are some cases in which inflation can actually increase your buying power.
Owning real estate with a low fixed-rate mortgage (which many Americans took advantage of when interest rates were historically low) provides an example of the good side of inflation for our finances. My wife and I purchased a home in 2012 with a 3.25% fixed rate mortgage. While my taxes and insurance have increased since then (mostly because my home value increased) my principal and interest—the majority of the mortgage payment—stayed exactly the same. Over the past 13 years, my monthly payment increased by an average of just 1.08% per year—way below the housing inflation rate over that same period. Even with increased maintenance costs and utility price increases, my overall housing costs were well below the published inflation rate.
We can also benefit from rising house prices (aka housing inflation). We own a fraction of our houses while we’re paying off the mortgage, but we keep all increases in home value when we sell them. For example, if I put 20% down ($100K) on a $500K home, and the home increases in value by 4% during the year, then my investment increases—not just by $4K (4% of the $100K down payment), but by $20K (4% of the full value of the house at $500K). This compounds year after year, so a 4% increase the following year would be on $520K, and so on.
Incomes tend to rise over time, due in large part to inflation.
While my mortgage payment grew slowly, my income greatly increased from inflationary pressures. Most years as a government employee, I received a cost of living pay increase and often a merit-based pay increase and/or promotion. Similarly, my wife’s teacher salary increased significantly over the same period. My monthly military pension used to be a couple hundred dollars more than my monthly mortgage payments in 2012, but in 2025 it is a couple thousand more each month thanks to compounding cost-of-living adjustments to offset inflation. My buying power has increased because my income has increased far beyond my routine expenses for food, housing, and transportation.
But what about retirees who are on a fixed income?
Social Security and most pensions, as well as real estate and income from smart investments (e.g., low-cost broad-based index funds) are inflation adjusted, meaning their buying power remains steady despite inflation. As prices rise, so do these income sources. In 2022, Social Security was increased by 8.7%, equal to the government’s calculated inflation rate. So, while there is a slight lag, Social Security keeps pace with inflation. The same is true for most pensions.
Similarly, if you have real estate rental income, the monthly rent is increased to keep pace with housing inflation and, since the principal and interest of the mortgage is fixed, this income can exceed your increases in rental expenses over the same period of time.
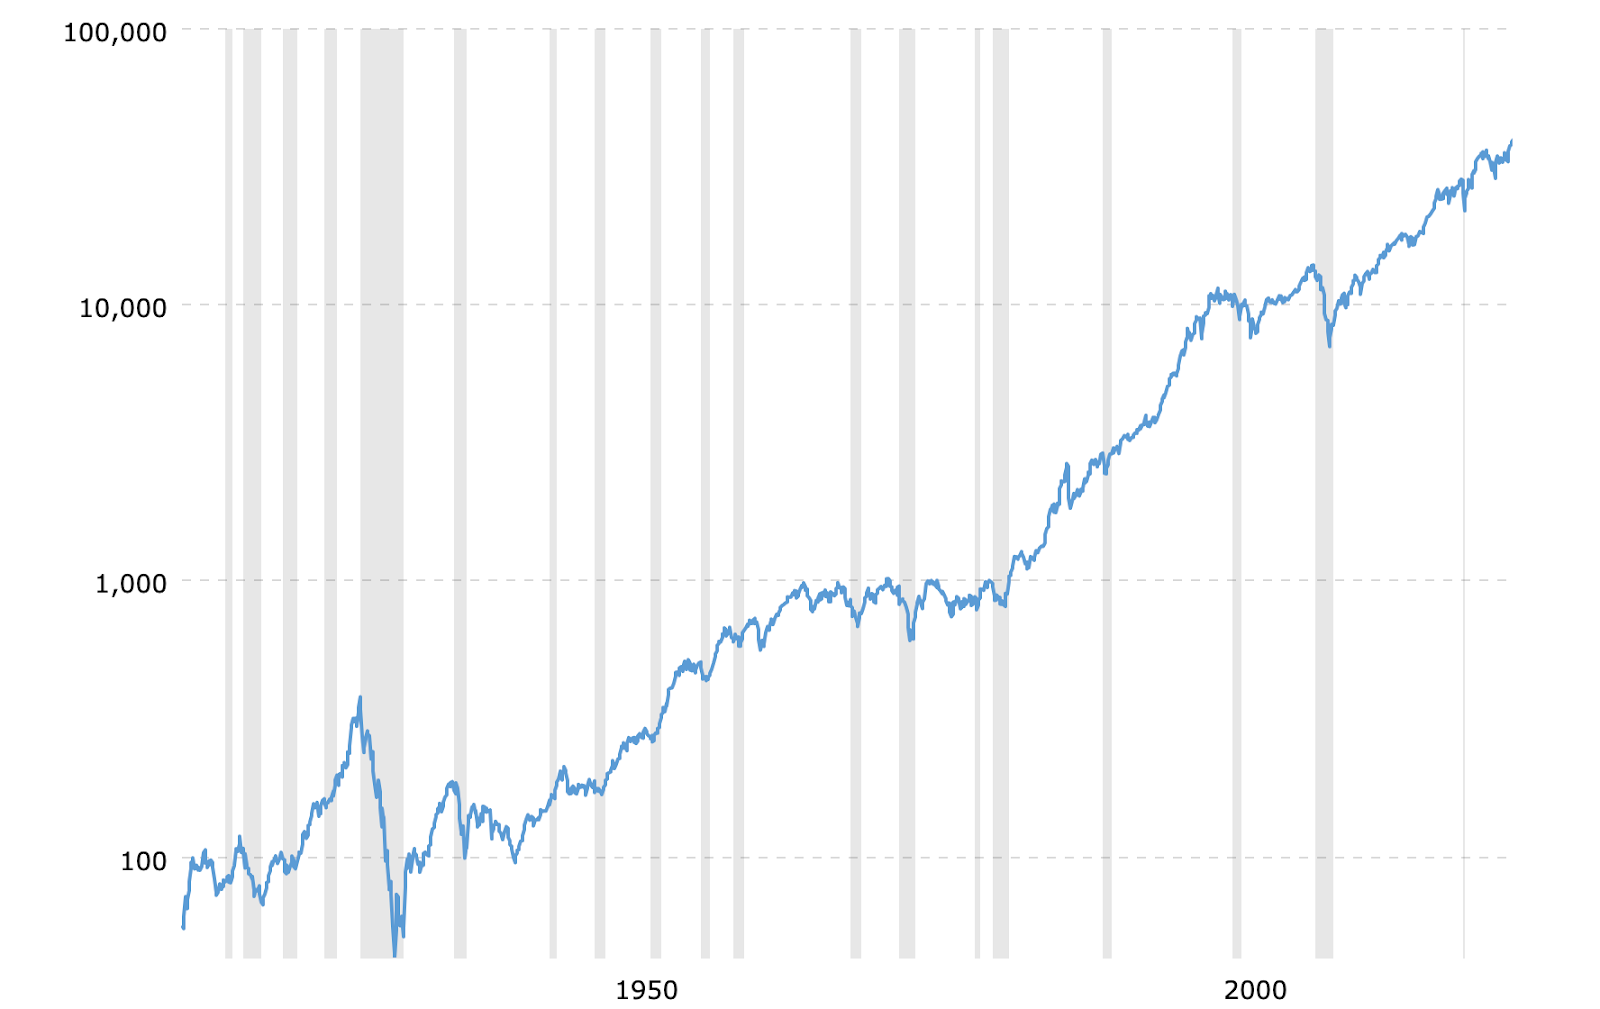
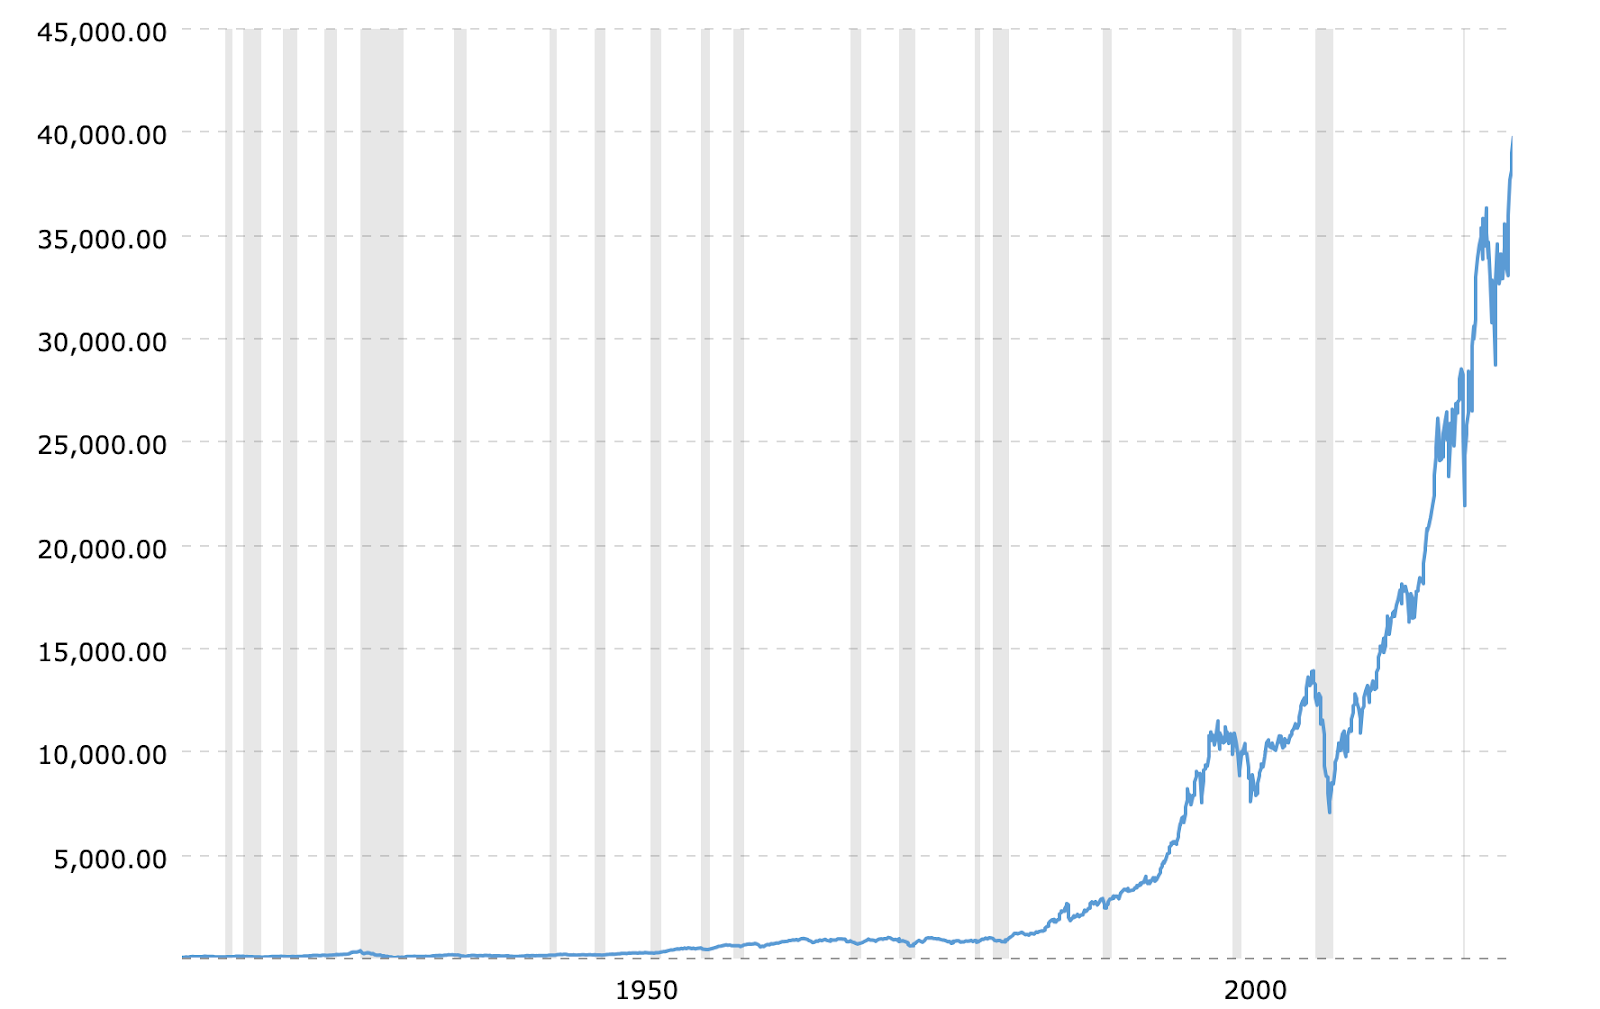
Over time, average returns on investments such as stocks and bonds tend to outpace inflation and can give us more buying power, not less. If we follow best practices for investing and take annual safe withdrawals from investments that are inflation adjusted each year, then our investment income in retirement will keep up with inflation.
My Personal Inflation Rate—Some Examples
By understanding the components of governmental inflation rate calculations, we can identify how our personal inflation rate differs—in my case, my personal inflation rate is usually lower, while my income is usually higher.
The U.S. Bureau of Labor and Statistics (BLS) calculates the CPI annually. It determines spending categories (housing, transportation, food, etc.), weighs those categories based on what the average American spends in each, and finally identifies inflation in each category (see BLS CPI weighting chart).
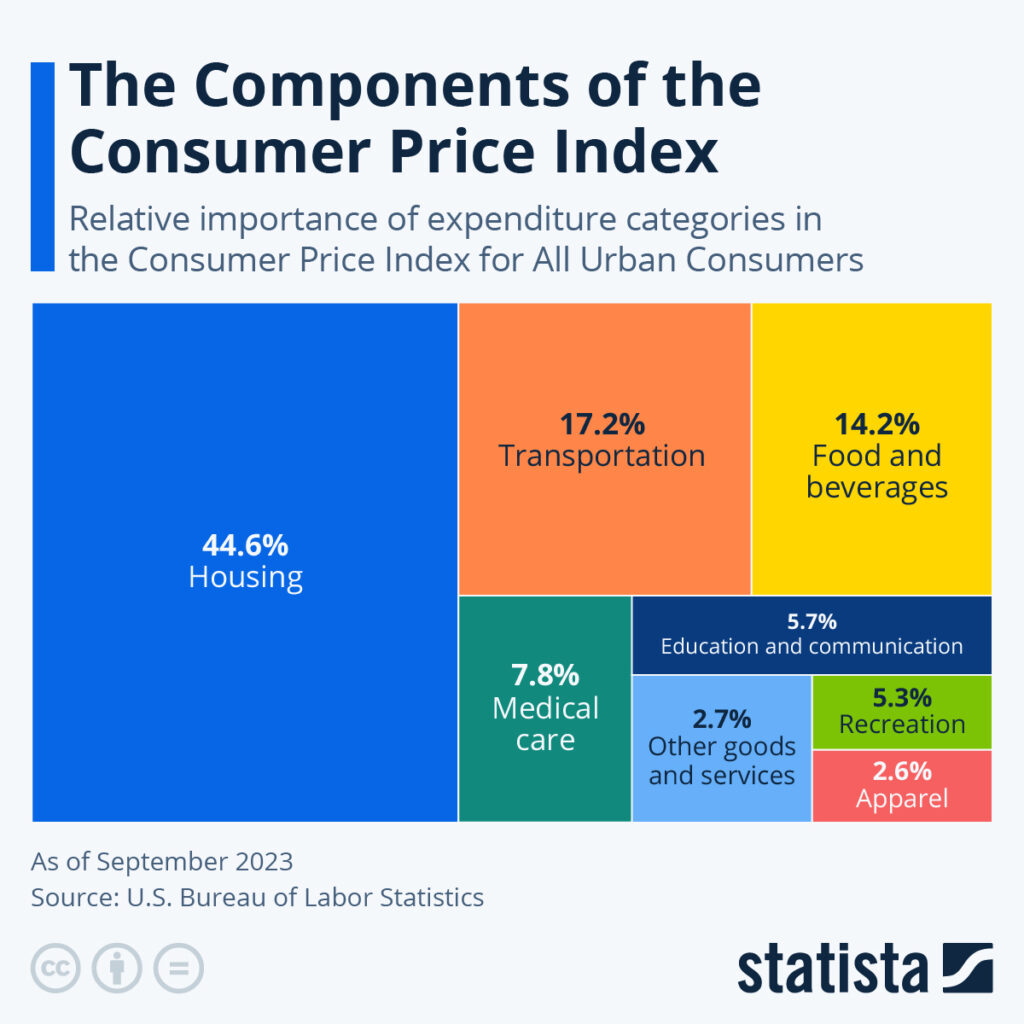
In 2023, increased housing expenses across the nation represented 44.6% of that year’s inflation rate of 4.1%. Housing is usually a household’s biggest expense, but if we have a low fixed-rate mortgage, our housing costs are likely to rise slower than for people who rent. Why? Because the CPI is calculated using average rent increases for renters and “imputed rent” (an estimate of what one would pay to rent the house they own) for home owners. Imputed rent is calculated using actual rents of comparable homes in the area. So, the housing inflation rate is fundamentally based on increases in rents.
Thanks to the fixed portion of mortgages (principal and interest), housing inflation for homeowners tends to be lower than that of renters over time. For example, my housing cost (mortgage plus maintenance) increased by 2.42% from 2021 to 2022, but average rent prices increased by about 6% nationwide in the same time period. That means that my personal inflation rate for housing was less than half of the national rate.
Each person spends differently than the “average” person. For example, if you don’t have any education expenses in the last year, then your weight would be zero in that category. But even if you do, some institutions offer tuition guarantees, which lock in your tuition costs for every year of attendance. Choosing a college or university with a tuition guarantee is one way to neutralize the impact of inflation on our education spending. Both our now grown children went to universities with tuition guarantees, eliminating the impact of ongoing inflation in the education category from our personal inflation rate.
In the healthcare category, a personal inflation rate can vary greatly from the average in the CPI. For example, my wife and I have military and veterans’ healthcare benefits, so we spend a lot less than the average American on healthcare. Our insurance premiums are lower as are our out-of-pocket medical expenses. As a result, inflation in the healthcare category is weighted a lot lower for us (2.5%) than the 7.8% for the average American. Once again, our personal inflation rate is different from the national numbers.
In addition, my wife and I embraced minimalism. We no longer buy as many goods such as apparel or decor as many Americans. We avoid upgrades of our cell phones and electronics, and we don’t drive cars as much. In fact, we have been car-free for the last two years as full-time nomads. (But even when we did have cars, our transportation represented 4% of our budget, not the 17.2% used by the CPI.) These minimalist choices made big differences in our personal inflation rate across many categories.
While the examples from my life may not be practical for every financial situation or lifestyle, they illustrate how accounting for inflation is more than just budgeting extra for groceries each year. When we focus on what we value most and let the rest go, we also have a hedge against many of inflation’s “bad” effects. By living an unconventional life and controlling expenses, often buying less expensive alternatives, we have gained a lot of control over our personal inflation rate.
Perhaps best of all, we don’t have to panic when we hear the latest scary national inflation rate in the news, because we’ve thought through our personal inflation rate, and we know the difference.
Inflation is a fact of life, but it doesn’t have to derail your financial journey. In some cases, it could even be a help.
Post cover photo by Markus Winkler on Unsplash