
(Originally published Feb 1, 2023. Revised—substantial edits in italics) The FIRE community talks a lot about the rent vs. buy discussion. Which is the optimal financial decision for your personal housing and how to calculate that? While there is great information out there to help you decide, I see two important considerations often left out of these discussion:
(1) Many compare a short horizon for buying a house with a long horizon for investment of down-payment funds by renters (opportunity cost). A long-term horizon should be used for both.
(2) Many overlook the long-term impact of inflation on this financial calculation.
If you treat your personal home as an investment (for example, avoid unnecessary house upgrades and be willing to rent out your home if you need to live elsewhere for a while) and use the same long-term buy-and-hold strategy that an index-fund investor uses (a 10 to 30-year horizon that smooths over the ups and downs), then buying a home for your personal use (in other words renting to yourself) is often a better investment than renting from someone else––especially due to the power of inflation.
The pendulum has swung on this topic. For years, the common advice was that “renting is throwing your money away” and “your house is your biggest investment.” In response, many prominent articles, blogs, videos, and podcasts have weighed in on this decision arguing the wisdom of renting. These include:
JL Collins: “Rent v. Owning Your Home, opportunity cost and running some numbers” and “Why your house is a terrible investment”
Go Curry Cracker: “How I Made $102k in Real Estate and Am Poorer For It”
Preconceived Podcast interview with Brad Barret: “173. To Buy or To Rent?” and ChooseFI episode “House FIRE | Ep 414“
Next Level Life YouTube video: “Should You Buy A Home or Rent? | Renting Vs Buying A Home”
NYT Article: https://www.nytimes.com/2014/05/22/upshot/rent-or-buy-the-math-is-changing.html
NYT calculator: https://www.nytimes.com/interactive/2014/upshot/buy-rent-calculator.html
While each of these pieces have great information, they didn’t fully include the power of inflation over time for both increased rent prices and the inflation-hedge of a fixed-rate mortgage. The one exception is the NYT calculator. It did include inflation, but it did not appear to weigh inflation appropriately if you own your house over a long period (based on my testing of the calculator parameters). I believe that omission misconstrues a key part of the Rent vs. Buy financial evaluation.
This post is responding primarily to the first article by JL Collins and uses JL’s comparison formula as a starting point.
Why does Inflation Matter?
(1) Because rents generally increase over the long-term, but fixed-rate mortgage payments (P&I portion) stay fixed. And (2) while the value of a home rises slower than the stock market index, that smaller increase is for the entire value of the home—not just the down payment and other accrued principal. For example, $100,000 in the stock market getting say a 12% avg annual return is the same as a 3% return on a home valued at $500,000 with a 20% down payment of $100,000—both gain $12,000 in value the first year (excluding taxes on those gains).
We have seen recently how the increase in inflation and increased demand for remote work have generally increased home prices across the nation. Rents have also dramatically increased. One article indicates the U.S. medium rent amount has increased by an average 8.85% per year since 1980 (although not in either of the two areas I own homes). But even in times of lower inflation, house prices and rents tend to rise over time. In recent memory, only 2010 gave the U.S. real estate market a very short period of rent deflation.
So the longer you hold your low fixed-rate mortgage property (assuming you refinanced at the historically low rates between 2012-2021 time frame), the greater benefit you will have from inflation as the majority of your house payment will stay the same over time. The amount you would pay in rent would increase over that same period. To illustrate below are a couple of examples from my own experience below.
But first, a couple of caveats and assumptions:
- Real estate is local. I use a Midwest example and an east coast example.
- I’m not asserting that buying a house is the BEST possible investment. I contend that it can be a GOOD investment (part of a diversified investment portfolio) and often better financially than renting a comparable house when all numbers are considered.
- I assume you’re familiar with investment returns and other general financial concepts, so I’m not getting into lengthy explanations here.
- My buy-and-hold strategy for houses means that if I decide (or am forced) to move I will rent the house until I can return—I won’t sell. Selling a home too soon changes the calculations and makes buying less likely to win the financial comparison.
- If I do need to rent my house, I do not hire a property manager (more on this below).
- I ignore renter’s insurance. I agree with Jeremy at Go Curry Cracker that I can self-insure. If you can’t (many landlords require it) or don’t wish to self-insure, add that cost to renting.
Running The Numbers
I fully agree with JL that the key is to run the numbers for your specific situation and not assume one choice is automatically better than the other. However, JL’s example (and formula) appears to undervalue inflation benefits over time for principal and interest. For example, in his blog post comments he equates rent inflation increases to be equal with inflation increases in property taxes, insurance, and maintenance and thus offset each other. However, my data indicates otherwise because the majority of the mortgage payment is P&I which remains the same over time.
Also JL provides a very high repair, maintenance, and insurance cost of $7000 average per year (in 2012 and prior). National averages for repair and maintenance are approximately $3,000 per year and insurance certainly doesn’t cost $4,000 (EDIT: except maybe in parts of Florida (see note at bottom) and other flood prone locations where I wouldn’t buy anyway. There can be foolish investments in real estate the same as the stock market. Also, my insurance bill in 2024 was $1,145 on a $1M home in Va and $1,108 on a $400K home in OH—less than 2023). My records for the two houses I own show a much lower average for maintenance and repair costs. The breakdown for each is as follows:
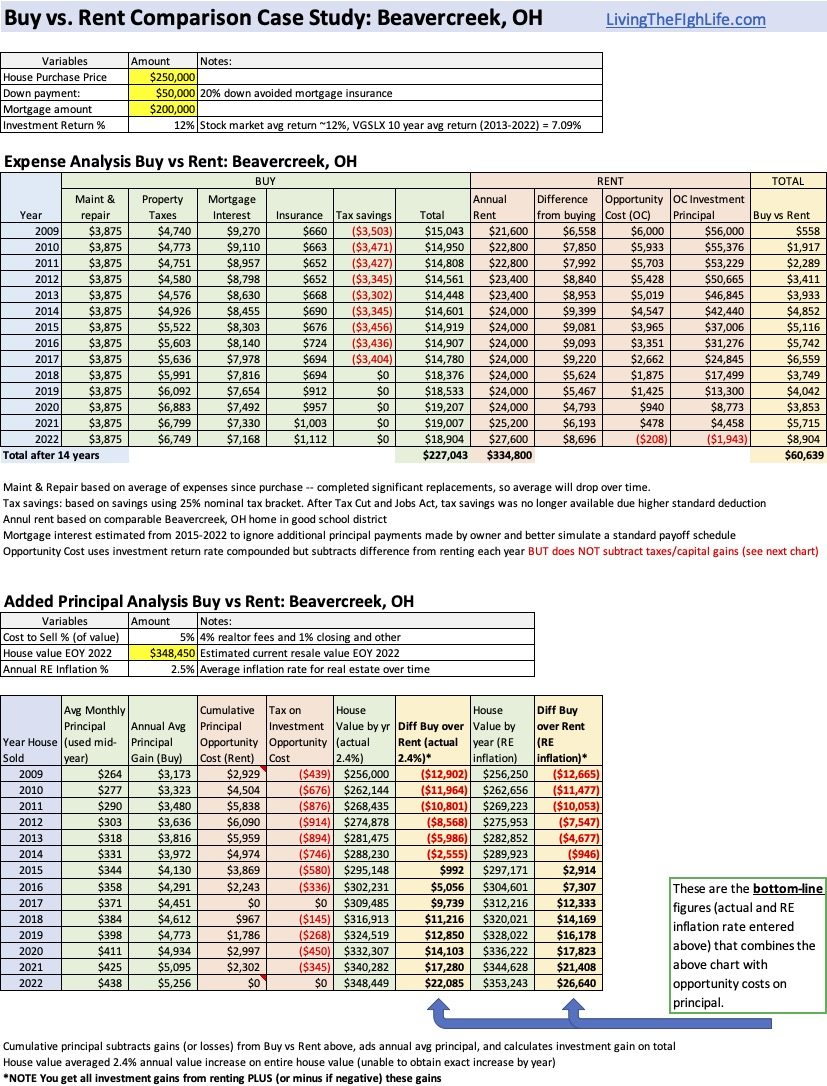
For my large Ohio house, even after reroofing ($13K); completing a $3500 tree trimming; replacing the fridge, dishwasher, air conditioner, furnace, garage door opener, new bathroom floor, and decking (Trex composite); having the whole interior repainted professionally and completing numerous other small repairs and maintenance, I have averaged $3,784 per year over 13.5 years. I expect this average to go down now that I have upgraded the primary systems, and when I add insurance, it increases to $4,548 average per year—still significantly less than JL’s $7K figure.
My home in Virginia has cost me much less in maintenance and repair ($1635 per year for 10 years). In part because I enjoy doing a lot of repairs and maintenance myself, but primarily it’s because I’ve had fewer major system replacements (I did paint the interior, re-roof, replace the gas lines, install new windows, and replace the stove). (EDIT: For my calculations I used the national average of $3,000 and deflated it back through time, so it is higher than what I actually paid to account for my personal time invested.). See note at bottom on the cost of time and effort as a renter that most people ignore.
So, while I had a couple of expensive years with repairs and maintenance for both houses (especially those new roofs), the key is that these costs even out over time IF you hold onto your house. Those roof shingles usually need replacing only once every 30 years. (EDIT: Look for a house with newer systems AND don’t sell your house soon after making major repairs like a new roof—that is just handing value to the buyer that is likely not in the selling price)
I did not include any costs for upgrades (EDIT: I treat my house like a rental–I am the renter AND the landlord. If I wouldn’t pay for an upgrade for other renters, then I am not paying for it for myself). I find most upgrades (such as an upgraded bathroom or basement renovation) tend to be net financial losers as they rarely return full value for the cost in increased home value, especially when you look at opportunity costs of using that money elsewhere.
Similar to JL’s buy-and-hold strategy for stocks, we need to buy-and-hold when we buy a house. Just as you should hold your stocks for 10+ years, hold your house for 10+ years or more to get the long-term investment returns and most benefit from inflation. (EDIT: I made back my investment long before 10 years as you see in the results below, but this is the mindset that is needed to ensure a long-enough runway to win out over renting in most markets or mortgage interest rates)
These returns get better with each year as the mortgage payment typically grows at a much slower rate than rents do and homes tend to increase in value—on average around 3.5% to 3.8% per year.
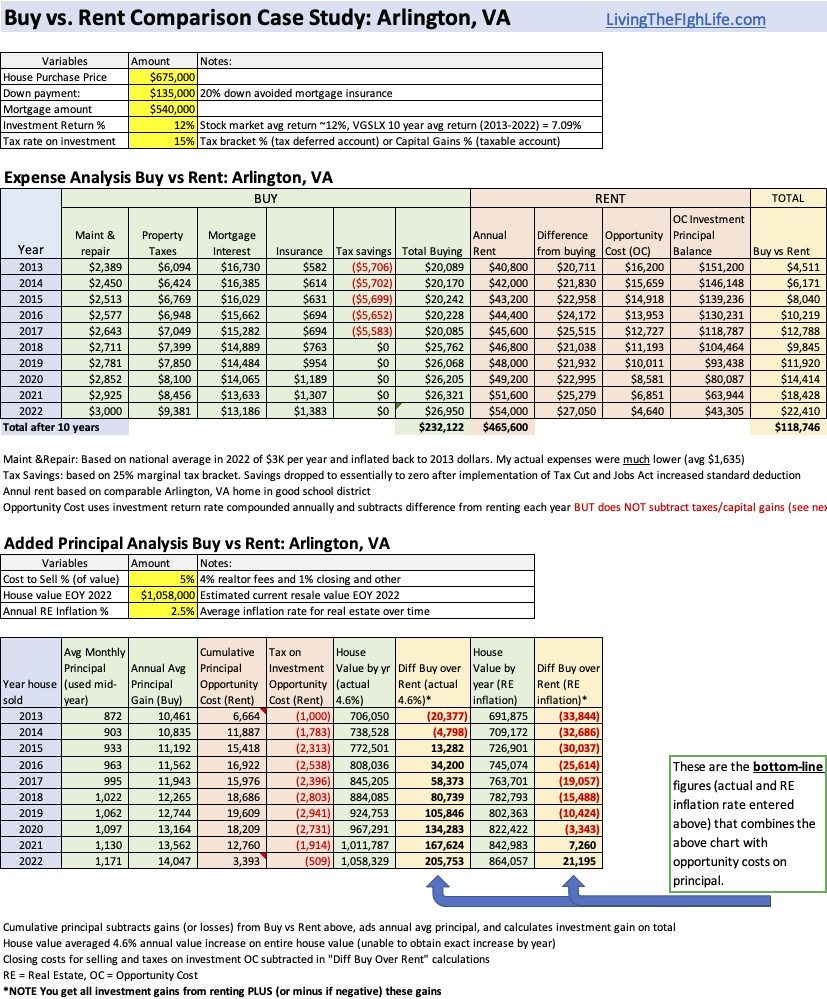
Again, real estate is local. My home in Arlington, VA has increased in value by ~48% since 2013 (avg 4.6% per year) while my home in Dayton, OH has increased ~37% since 2009 (avg 2.4% per year). But I am not selling either house any time soon as I am enjoying how inflation is my friend in both markets.
Apples to Apples
JL compared his large house he owned to a small apartment he planned to rent when he was downsizing. As he states in his comments, he did an apples to oranges comparison. But an apples to apples comparison may be more relatable for many people looking to make a buy vs. rent decision between two comparable houses.
When my wife and I went from being a couple to having a family, we shifted from an apartment to a house. We wanted the larger space, the yard for the kids, and the good schools that often come with SFH neighborhoods. We knew where we wanted to live and the size of the home we wanted—we just needed to decide if we should buy or rent that house.
So instead of comparing the rent for a small apartment to rent for a family-sized home as JL did, I believe comparing renting a 3+ bedroom/2 bath home to buying a 3+ bedroom/2 bath home is a more common situation when considering whether to rent or buy in a particular location. So in his example, renting vs. buying comparable apartments.
In Arlington, VA in 2013, rent for a comparable house to the one we bought would have been $3,400 per month while our mortgage house payment was $2783 (3.25% interest). Our first month’s principal of that payment was only $857. Since principal increases a little every month, I use the mid-year monthly numbers when calculating the annual amounts to track the opportunity costs.
Getting to the Math
To make the financial comparison, JL’s basic formula is:
Opportunity cost (equity * annual investment return %). [Note: JL used VGSLX because he would otherwise invest in real estate. This number needs to be lowered for taxes (JL’s formula did not appear to do that)].
+ Total annual cash expenses which comes from adding up these annual outlays:
- Maintenance & repair & insurance
- Real estate taxes
- Mortgage interest (note: excludes principal)
- Subtract tax deduction savings
Total annual cost of owning and operating the home = Opportunity Cost + Total expenses.
Subtract annual rent to get annual premium (or savings) to live in the house FOR a single year.
JL’s formula doesn’t appear to factor in inflation over time. I have created a spreadsheet (see images below) using the detailed numbers for my Virginia and Ohio homes over time to indicate that, early on, renting is likely better (depending on your investment return and inflation variables). But, over the long-haul, buying (depending on your variables) is likely better—due primarily to inflation.
In my spreadsheet, I factored in opportunity cost for the down payment AND the amount of principal that is tied up in the house over time using the same investment return rate compounded annually.
But even with a high average investment growth rate (12%—much higher than JL’s 3.5%) and lower than average real estate value growth (2.5%) both houses were more profitable to buy AFTER several years (9 years VA and 7 years OH), and they got better over time even after the tax benefit was reduced by the Tax Cuts and Jobs Act of 2017. Based on actual property value growth rates I saw profitability at 3 and 7 years, respectively.
Here are the Virginia house results:
…and here are the Ohio house results:
If you would like to play around with the numbers yourself (e.g., adjust investment returns, inflation, or add your own house numbers), you can download the unprotected spreadsheet here:
Be careful not to change the cells with formulas, as that could break the spreadsheet’s functionality. If you see an error or something missing, please let me know in the comments and I’ll take another look.
A few more notes:
While some locations may not achieve 2.5% inflationary growth, they can still be the better financial choice over renting, but you will need to hold the property over a longer period for the inflation-related benefits to make it worthwhile.
In the year you sell the house, reduce the opportunity costs from renting by the amount of the taxes/capital gains on those investments. Houses that you have lived in for at least two of the last five years provide a generous capital gains exclusion ($250K for single, and $500K for married filing jointly). (EDIT: This is a huge advantage for real estate over after-tax stock investing. When I sell I can get a $500K capital gains exemption and not pay the 15% rate on gains from selling my stock (my likely rate with my military pension, social security, tax-deferred account withdrawals and other income. That is a potential $75K tax savings over similar gains from stock or other long-term investment gains.)
You might be wondering, “what about closing costs?.” Good question. I paid ~$6K to close on my VA house in 2013. I would have locked up around the same amount on first, last, and deposit on renting a house, so that’s a wash. After 20+ years, the $6K is a deflated pittance on either score sheet. (Note that the landlord often increases the deposit amount if they raise the rent.) I did account for selling costs such as real estate agent fees in my spreadsheet when calculating the capital gain for each house. (EDIT: with recent changes to the RE agent fee structure, I do not plan on paying more than 1% for either buyer’s or seller’s agent)
Property manager costs: I see small-time real estate as passive income (or I make $2,800 per hour!). So for this calculation I did not include hiring a property manager if you need to rent your house out. This is a whole separate article, but like self-insuring instead of paying the renter’s insurance, I do my own property management. I have found the time costs to be negligible and property managers not worth the money in my experience.
Making additional principal payments toward the mortgage isn’t supported by my data. By doing so, you would lose some of the benefit of paying off a fixed P&I amount with future inflated dollars. Many people’s wages receive inflation adjusted raises and make paying off their mortgages easier over time. Also, the more money added to the principal will negatively impact the opportunity costs comparisons as the house value will change (usually it will increase) regardless of how much principal is paid. (EDIT: even if you have a high interest rate, the amount of interest saved is minimal. I focus on re-financing as soon as interest rates drop a full point or more).
You might be thinking “but what about all of the time an owner spends on his house that a renter doesn’t like managing repairs?” Being a renter doesn’t mean that you don’t have to spend time when things break. As someone who has rented 2 apartments and 9 houses and owned 3 homes (and later rented them out), I have found that for ALL of the houses I had to do the yard work and clean the gutters regardless of my ownership/renter status. I also spent as much time calling the landlord (often several times hoping he/she will respond in a timely manner), the back and forth negotiating time and date for repairs while the landlord coordinates with the repair company, and accommodating the actual repairs (I keep an eye on maintenance workers in my home) whether I rent or own—so for me it is a wash. Also, things like frozen pipes and vandalism occur in rentals the same as any home and the impact (loss of personal property, waiting for insurance claims to work, inconvenience of getting it fixed) greatly effects the renter’s time too.
Bottomline: Inflation makes a big difference
My decision to buy instead of rent in Arlington, VA returned roughly $206K over the last 10 years than I would have gained with renting a comparable house and investing the down payment and principal.
Likewise, my Ohio house returned roughly $24K more in the last 13 years than a comparable rental. This is despite having lower than average capital appreciation (2.4% vs. 3.5%). (EDIT: This house jumped in value by $56K (16%) and rent has increased to $28,800 (4%) annually in the 2 years since I did the calculations (2022 #s)—now my gains are a lot more!)
While $24K may not sound like much, don’t forget that these returns are above and beyond what I would have gained if I rented a comparable house and invested my available down payment cash at a 12% annual average return. This difference would be even higher if I had invested in real estate index funds (e.g., VGSLX which returned ~7% per year 2013-2022) or the 3.5% dividend amount that JL used for his calculation.
This only works if you keep the house for the long-haul. If you are going to sell before you breakeven, then renting is the better financial choice.
I hope this helps you to calculate the long-term financial value of renting vs. buying a comparable house, and helps you make a decision that’s best for your situation.
Addendum: After completing my analysis I stumbled onto Nerdwallet’s Rent vs Buy calculator. This has comprehensive variables you can input to make your comparison. I like the graphic that shows when the cross-over point will occur for buying vs. renting. However, I cannot access their formulas, so I’m not sure how they work behind the scenes. It uses statewide average property tax rates which do not reflect many local tax situations. Likewise, I find using a percentage of property value as a poor measure for repair and maintenance costs. For example, my less expensive OH house cost a lot more to maintain than my more expensive VA home.
I think my spreadsheet, updated each year using actual annual investment returns and inflation rates, will provide a more accurate picture if you wish to track your house’s real time performance and whether it’s better to rent or sell if you need to leave your home for an extended period of time. Note, high investment returns or capital appreciation percentages later on are less valuable than high returns early on due to sequence of returns and the power of compounding.
NOTE ON FLORIDA: I was hearing horror stories about outrageous insurance costs in Florida (which many are true). My friend who lives in Orlando and has a nice house with a pool shared his annual insurance cost which was nearly $2,956K while my $1M house in VA was only $1,145 for the year. That is almost triple the insurance cost BUT comparing property taxes of just $2,065 for his house in FL compared to $9,400 in VA, the FL house is still far less expensive to own. Even my OH house’s insurance and taxes far exceed his FL home. So while insurance in FL is very high, property taxes are very low and may make buying in Florida an option (I’m still hesitant about the hurricanes and other challenges in the state).